
Cameras
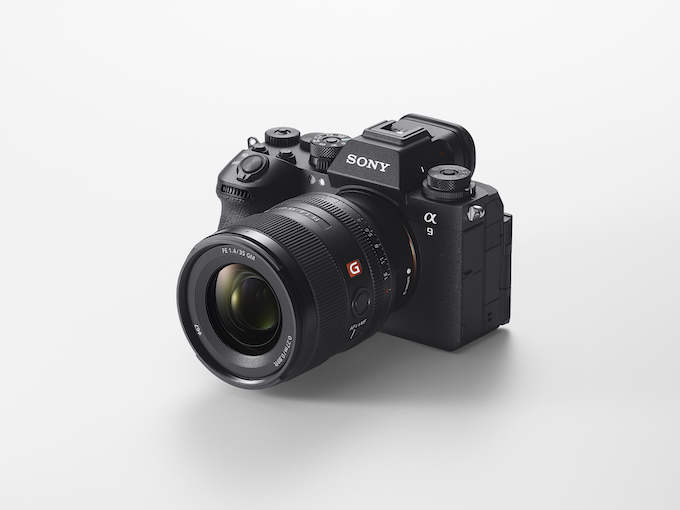
Deep Dive: A Technical Review of the Sony a9
November 15, 2017
Rangefinder is a member of the Technical Image Press Association which has contracted with Image Engineering to perform detailed lab tests of digital cameras. See here for a full methodological rundown of how Image Engineering puts cameras through their paces. Full res files of every visual in this review are available to download for your pixel-peeping pleasure here. Read our hands-on review of the Sony a9.
Resolution
- The camera shows very good resolution at all ISO speeds tested (ISO100 to 204800). Lab measurements show that there is measurable loss of resolution as ISO increases, but the differences are barely discernable by eye. Overall, resolution can be said to be very good at ISOs ranging from 100 and 6400, which means the camera can be used in a variety of light conditions without worrying much about loss of resolution.
- The Sony Alpha 9 makes full use of its 24 megapixel sensor.
- As ISO increases, reproduction of detail decreases, with the most noticeable drop at high contrast between ISO 1600 and 3200; at low contrast, reproduction of detail drops once the ISO is pushed above 800.
- If one visually compares images taken at different ISOs of the central Siemens Star in the TE42v2 test chart, one can observe that there is very little difference between ISO 100 and 1600, and only a very mild greying of the central area at higher ISOs.

This graph shows the loss of contrast (y-axis) as a function of the spatial frequency in line pairs per picture height (x-axis) for different ISO-sensitivities (colored lines). The further to the right a curve stretches before descending, the better the resolution at that ISO. An upward bump in a curve represents in-camera sharpening. The limiting resolution for each ISO can be found by identifying to the highest spatial frequency which results in a contrast of 0.1, or where the ISO curve crosses the thicker horizontal thicker black line marking 0.1. The vertical pink line is a reference representing half the number of pixels in the sensor height (the Nyquist frequency).
Texture loss
- Texture reproduction of high-contrast patterns is very good at ISO 100 and 400. There is very little difference in texture reproduction between 100 and 400, which is very good. Texture reproduction remains fairly good up to ISO 1600.
- With higher ISO, there is increased smoothing and thereby loss of texture even in high-contrast scenes. This is particularly pronounced above ISO 6400.
- Accurate capturing of low-contrast texture patterns is good at lower ISOs up to ISO800.
- At higher ISO, the loss of texture in low-contrast scene is very noticeable: at ISO 25600, the texture that can observed in the low-contrast pattern is much less than that in the high -contrast pattern. However, even at ISOs which might be used more frequently, such as ISO 1600, in high contrast scenes with detail, such as the ‘dead leaves’ pattern on the test chart, many of the smaller details are smoothed out of the image and thereby lost.
- Examination of the reproduction of images of grass and stone (on the test chart) show that the linear grass is reproduced well up to ISO 1600 but not at higher ISOs.

An artifact is an alteration in a digital image due to technology or technique of processing. Artifacts stem from noise, compression, and sharpening. This graph plots the calculated difference in digital signal between two methods (DeadLeavesCross & DeadLeavesDirect). The colored lines represent response at different ISOs and in reference to a high-contrast target and a low-contrast target. Values plotted are the Dead Leaves SFR difference against the spatial frequency. The larger the area under the curve, the more artifacts are present. Thus, one can see that at the higher ISOs of 6400 and 12800, the Sony Alpha 9 records quite a few artifacts in low-contrast situations, although the high-contrast images are much cleaner.
Edge contrast / sharpening
- The tests of the camera at ISO speeds from 100 to 1600 show slight over- and undershoots at high contrast edges. This means that the images retain a natural look.
- At ISO speeds of 3200 and 6400, the overshoot and undershoot are enhanced but still do not create an artificial look.

This graph shows the degree of sharpening in the image by representing an over- and undershoot along contrasted edges. The colored lines represent measurements at different ISOs and in high- and low-contrast situations. The size of the dip before the edge (in both depth and breadth) indicates the degree of undershoot; similarly, the amount overshoot is indicated by the height and breadth of the peak. Thus, larger dips and/or peaks indicate that a sharpening effect is visible. The sharpening in the Sony Alpha is moderate and an improvement over the previous generation 7-series.
OECF VN / visual noise
- Visual noise interferes very little with the image at ISOs up to 3200 (in Viewing Condition 1, 100%).
- Visual noise becomes detectable at ISO 12800 and continues to increase as ISO increases.
- Visual noise interferes with perception of detail and texture. Thus, images made at ISO settings over ISO25600, at which the visual noise is measured at 2.6 in Viewing Condition 1, are unlikely to show satisfactory image quality. Therefore, the higher ISO speeds should be used only when necessary

This chart shows the noise behavior at various ISO-sensitivities (colored lines) as a function of the brightness of the target image, which is indicated by the relative darkness of the circle on the outer edge of the diagram (noise in shadowed areas are above, and in highlights below). The larger the area inside a curve, the stronger the noise. The degree to which noise disturbs the appreciation of an image, depends on the image size and the viewing condition. The right-hand side of the chart shows the visibility of the noise in an image that is displayed 100% on a monitor (VN1). The left-hand half shows the visibility of noise in a 40-cm tall print (VN3).

This chart shows the noise behavior at various ISO-sensitivities (colored lines) as a function of the brightness of the target image. The perception of noise is represented by the area that is encircled by the curve. The larger the area, the stronger the noise. How much the noise disturbs the viewing of an image, depends on the image size and the viewing distance. This chart shows the noise visibility for an image that is displayed 100% on a monitor (VN1).

This chart shows the noise behavior at various ISO-sensitivities (colored lines) as a function of the brightness of the target image. The perception of noise is represented by the area that is encircled by the curve. The larger the area, the stronger the noise. How much the noise disturbs the viewing of an image, depends on the image size and the viewing distance. The chart shows the noise visibility for an image that is about postcard size (scaled to a height of 10cm) viewed at a distance of 25cm.
Dynamic Range
- The dynamic range is broad (over 9 f-stops) up to ISO 3200 with a peak of 10.1 f-stops at ISO 800.
Color Reproduction
- Color reproduction is fairly good, with only a few obvious deviations measured from the real color in the pure red range, and some visible deviation in other color tones.

Color reproduction is shown here in two ways. The upper figure is a chart comparing a reference color (right-hand half of each color patch) directly with the color reproduced by the camera (left-hand half of the color patch) Below is a table that lists the DeltaE of each color patch. Red cells indicated strong color deviations, light green cells represent colors with noticeable deviations, and a dark green field represents a moderate deviation.
Automatic white balance
- The automatic white balance delivers very good results
- Increasing the ISO speed does not cause noticeable changes in color reproduction.
Video
- The camera achieves a very good resolution in video for both high and low ISO settings.
- The texture loss in video is negligible, especially at the low ISO setting. At high ISO, a low contrast picture loses more texture, although the degree of loss is not unacceptable.
- The main difference in image quality at high ISO compared with low, is the degree of noise. High ISO video images show a noticeable amount of noise.
- Compared to still images, the Sony Alpha 9 sharpens more in video at high ISO. This is reflected in the sharpening graph by the wider and higher overshoot.

This chart shows the noise behavior at two ISO-sensitivities (ISO100 and ISO1600) as a function of the brightness of the target image. The amount of noise perceived is reflected in the size of the area encircled by the curves. The larger the area, the stronger the noise and its perception. The degree to which the noise disturbs the viewer, depends on the image size and the viewing distance. This chart shows the noise visibility for a video frame that is displayed 100% on a monitor (VN1). The noise of the Sony Alpha 9 is only moderate at high ISO and very acceptable a low ISO.

This graph shows the loss of contrast (y-axis) as a function of the spatial frequency in line pairs per picture height (x-axis) for two ISO-sensitivities in video mode (colored lines). The further to the right a curve stretches before descending, the better the resolution at that ISO. The video resolution of the Sony Alpha 9 is much better than that of the predecessor 7 series. The limiting resolution for each ISO can be found by identifying to the highest spatial frequency which results in a contrast of 0.1, or where the ISO curve crosses the thicker horizontal thicker black line marking 0.1. The vertical pink line is a reference representing half the number of pixels in the sensor height (the Nyquist frequency).

This graph shows the sharpening in the image due to an over- and undershoot along edges. Depending on the size (based on width and height) of the additional emerging area, a lower (shallower additional area) or stronger (higher and narrower additional area) sharpening effect is visible. The in-camera video sharpening of the Sony Alpha 9 is similar to that of the 7-series.
Start-up time
- The camera takes more than a second to start up (1.2 seconds). The shutter release delay is 0.05 seconds, which is hardly noticeable.
Continuous shooting
- The promise in the Sony press release of 20 frames per second were borne out in objective tests of continuous shooting in jpeg. The camera continued to shoot at this high speed until the memory card was full. In comparison, the Sony Alpha 7 could shoot 4.5 frames per second in jpeg, up to a maximum of 63 shots.
- Continuous shooting in RAW was measured at 12 frames per second, and also continued until the memory card was full.
- The capability to accept SDXC UHS-II cards expands the options of this fast continuous shooting.
Autofocus (300lx) Live View
- In normal light conditions, the autofocus takes only a fifth of a second to focus.
Autofocus (30lx) Live View
- Under low light conditions, the autofocus is also fast, taking 0.22 seconds.
In Depth
A peek behind the lens shows us the large sensor. Not surprisingly, this large sensor gives us images with a very good resolution and low amounts of noise, especially for the lower ISOs tested (100, 400, and 800). Textures are captured faithfully at these lower ISOs. Even images made at 1600 ISO show good resolution and low noise.
At higher ISOs, such as ISO 6400, noise is evident. The higher ISOs tested, such as ISO 25600, showed less impressive resolution, although advances in technology mean that this poorer performance is still equal to or better than an older high-end camera. At the same time, the degree of in-camera processing indicated by the test results, may not be desired by the serious photographer for whom this camera is intended.
Color reproduction is fairly good, with only a few obvious deviations measured from the real color in the pure red range, and some visible deviation in other color tones. It has a broad dynamic range of 10 f-stops at ISOs of 400 and 800. At ISOs above 1600, reproduction of different faces and skin tones are discernably shallower in tonal reproduction, although they are still acceptable.
Video
The image quality in video recording is excellent, as might be expected from Sony. Frames grabbed from videos at high ISO show a visible albeit small loss of resolution compared to frames shot at low ISO. Texture loss is negligible except when shooting low contrast scenes at high ISO, when there is smoothing but still not to a great degree.
A visual comparison of video frames shot at high and low ISO shows little difference in terms of color or perceived detail of a scene such as grass and stones. Color capture is similar at high and low ISOs. Different skin tones are reproduced well at both ISOs, although some tones do look a little washed out at high ISO compared to low. The most obvious difference in image quality when comparing video shot at high ISO and low ISO, is observable noise.
Related Articles
Is FUJIFILM X100VI the Compact Camera You’ve Been Waiting For?
March 1, 2024
The latest retro-style mirrorless from Fujifilm, the compact X100VI, generated a real buzz throughout the photo community as soon as it was announced. Its predecessor, the X100V, was extremely popular and initial reactions to the new model seem to indicate that the new model’s popularity will likely exceed that of the previous iteration. Physically similar to the four-year old model,...
More »
OM System’s New Flagship Camera: The OM-1 Mark II
February 13, 2024
It’s been a couple years since the OM-1 was announced, and a recent update moves the new OM-1 Mark II into the coveted flagship spot of the OM System (formerly known as Olympus) line of Micro Four Thirds cameras. This 20-megapixel camera utilizes a stacked sensor, and with up to 8.5 stops of image stabilization, is at home under low-light...
More »
Sony Announces First Full-Frame Camera with a Global Shutter
November 9, 2023
Sony’s latest announcement has certainly caused a stir among photographers. The Sony a9 III’s global shutter may be at the top of the list for many, but there’s a lot more going on in this incredibly fast third generation full-frame camera. Built around a 24-megapixel full-frame Exmor RS CMOS sensor, the a9 III’s global shutter—which reads all pixels at the...
More »
